

Before I go forward, you might be wondering, “Wait a minute. The UPS drivers, tens of thousands were planning their routes in their heads? Why? Didn't they have computers?” Well, in the hero's journey, there has to be a reason why no one before the hero has succeeded before.
In large corporations, the "villains" are almost always some version of the infamous Three H’s:
- History. “This is the way we've always done it.” UPS had for many years entertained and tested commercial vehicle routing packages, and repeatedly, their drivers outperformed them due to their detailed head knowledge.
- Hunches. “It feels right.” UPS’s massive size and unique complexities confirmed the bias that this problem was simply still too big for any software program.
- Hierarchy. “I'm the boss.” UPS management thought that decades of scrutiny and the big data that comes from millions of stops had left little room for major improvement.
“Jack, take your stuff and go elsewhere. This will probably be a dry well for you.” It is at this point in the journey that the mentor gives to the hero a magic talisman: a special sword or wand, a pair of ruby slippers, or a magic ring.
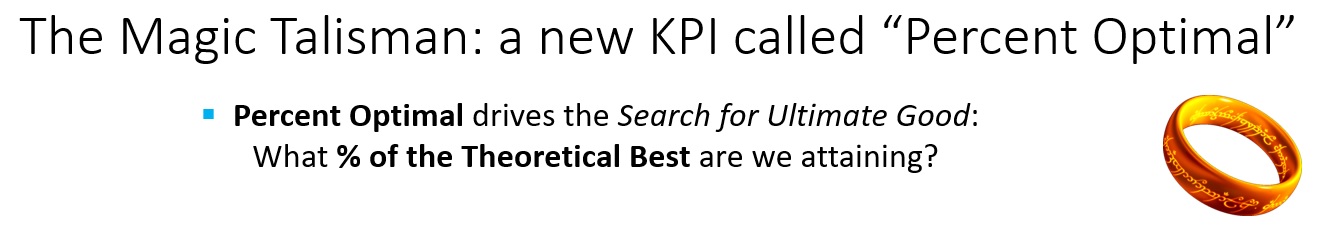
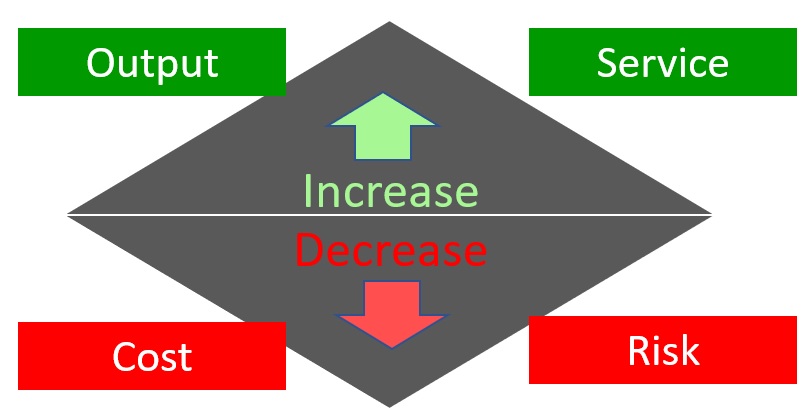
My gift to my hero was a new KPI that we call “percent optimal,” which is basically a search for the ultimate good. Percent optimal as a KPI is a measure of what percent of the theoretical best are we attaining. What do we mean by the best? It is almost always a combination of four things. The first two are to increase: output and service. The second two are to decrease: cost and risk.
At UPS, output would be how many packages delivered. More packages, more revenue. Service would be on‑time pickups and on‑time deliveries. Costs to decrease included driver payroll costs, fuel costs, and facilities costs. Risk would be putting too many packages on a driver and running the danger of missing service or cutting appointments too close.
At any given time, in any organization, we could assign numbers to these four items and score or schedule our plan? Such scoring allows us to look at how close we are to building the best possible schedule or plan. I advised Jack to proceed from the bottom up, not to go top down. Start with each driver each day. Take a driver, take the route on Monday, and ask, ‘What was the best possible route that could have been run on Monday?” Then Tuesday, then Wednesday. Then we take another driver and start from the bottom up.
Once we’ve got that nailed, we move up to the “building level” and examine, for all the drivers in this building for the week, what was the optimal time that could have been done, what percent optimal is being achieved. Then we proceed to a region, to a country, and all the way up to the enterprise.
Jack takes this KPI and runs with it. Jack and his team start with a small number of drivers. His team literally rides with him, and they hand‑collect field data. They custom‑build their own prototype and optimization system to create optimal routes.
Each time they show a route to a driver they are shown errors, such as “You can’t do that because you have to park over here and then you’d have to walk across the street to deliver over there,” or “There’s a median right there, and you can’t cross the street."
This is the data that was missing in all the map systems because it existed in drivers’ heads. Lots and lots of things like, “You can’t show up at that stop before noon because they’re never there—you have to hit them in the afternoon.”
Every time Jack’s team heard a problem, they would clean the data and correct the model, until one day they found that they could outperform any new driver. They knew what they were going to need in terms of data: to collect information about each stop, about the traffic and more. Now, they could calculate the percentage optimal after proceeding driver by driver, building by building, and region by region.
The reward is that our hero has three key takeaways.
- Optimal routes could outperform the status quo in all four dimensions at once. They could indeed reduce costs, but also increase output by building better routes. UPS could deliver more packages at lower cost. They could improve service and reduce risk.
- However, it was going to take a significant effort to collect, clean, and store all the missing field data—all the microdata about the different stops and customer preferences.
- If they succeeded, it would be beyond worth the costs of building an industrial‑strength version of their prototype model and collecting all that data. It would be a colossal win.
If you want to read more details about Jack, I featured him early in his success cycle as a case in my book, "The Optimization Edge," https://optimizationedge.com/, in 2011. I mention the year because the end of this hero’s journey comes five years later.
Here is Jack, with the UPS CEO and SVP of Global Engineering, accepting the 2016 Edelman Award, the most prestigious achievement in operations research. That’s how Jack fixed this department. Not bad!
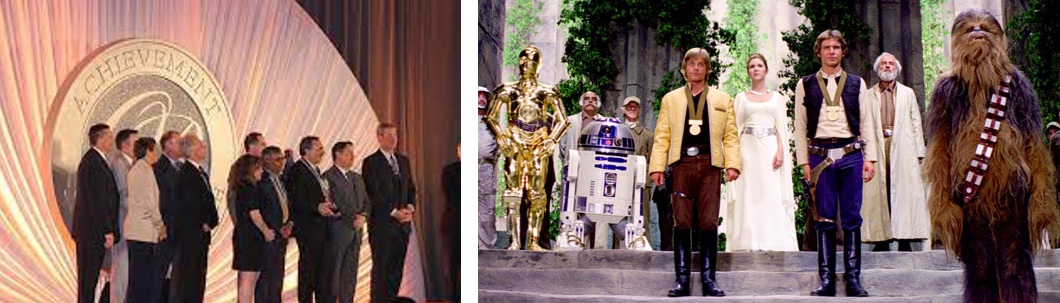
The award’s citation mentions that the optimizer, called ORION, saves 100 million miles of driving a year, which translates to 10 million gallons of fuel and 100,000 metric tons of CO2, which is good for the planet—and good for the bottom line. It was documented and independently verified that ORION saved UPS $300 million to $400 million annually. This reminds me of the end of Star Wars when the heroes' adventure ends with them receiving their medals and bowing. Roll credits!
In the next blog post, Steve will discuss how to replicate the hero's journey at your organization.