

Princeton Consultants employs a 7-step methodology that improves the likelihood of success and deliverability in optimization projects. Based on our solution development and deployment for many clients in varied industries, this approach helps create useful documentation, shortens the overall development time, improves code maintainability, and provides a natural feedback loop to business requirements.
The main tools leveraged are Python, which we find valuable because of its rich ecosystem that aids deployment, and the pandas library, because of its clean, sparse way to contain and manipulate data. We often use Python and pandas in concert with Gurobi’s Python interface, Gurobipy, and with other APIs such as IBM’s CPLEX, FICO’s Xpress, and Google’s OR‑Tools.
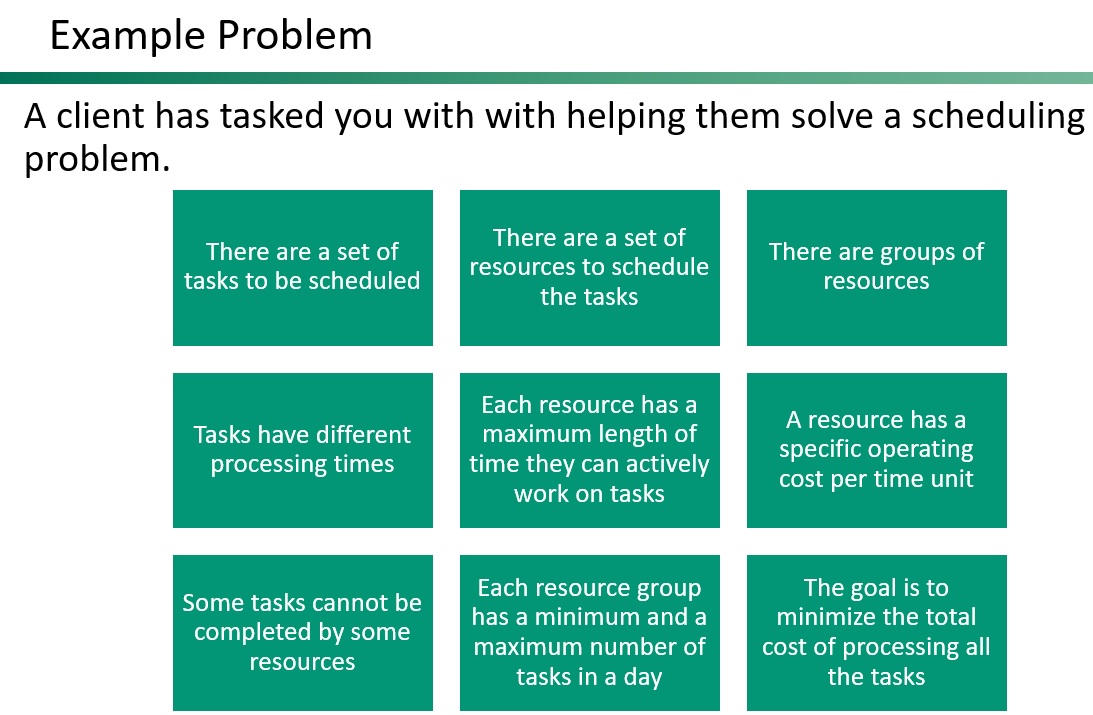
Step 1 – Understanding the Data
We work closely with clients to understand what data is available, its semantic meaning, how it is organized, and how different pieces of data are interrelated. In my experience, this is the most important step in any optimization project, an absolute necessity for ultimate success.
How often have you or a colleague built a model that is gorgeous, perfect and elegant—but there’s no data for it? I myself have done it, and found the data was not there, it was not stored. Before you start modeling, confirm what data is there and that it is complete. This will determine what type of model you can build, especially in machine learning or AI, which require accurate data for training or other applications.
The semantic meaning of the data matters greatly. A word or term can be used differently by different companies or in different places. For example, in the rail industry, “transit time” may include queuing, or it may be end-to-end. Make sure you understand what your client means in a field. Another issue to watch for is mismatched units. In one project, the column name was “Minutes,” but the values were actually in seconds. We often create a data dictionary for each table, which we review with the client to ensure agreement on terminology and what the data represents. This practice can benefit the client, too: when an organization has turnover, employees may not know what their own data means.
If one piece of data relates to another piece of data, how do they work together? Determine relationships and linking pieces so that, if you need to build a model with constraints on two different tables across each other, you know what those relationships look like.
Step 2 – Define and Document Datasets
Establish a format in which the client can deliver data to you meaningfully and consistently. On one project, every time the client gave us new data, the format was completely different. We generally use a concept of tidy data, meaning that all the variables or data inputs are in the columns, and all the observations are in rows.
When we create definitions, we often use mathematical notation to represent these data items. In general, we use markdown. We can use LaTeX notation because it makes writing easier and faster. Microsoft Word has come a long way in writing math, but it has not quite caught up to LaTeX for our purposes. In Visual Studio Code, using a tool like Pandoc, you can export the markdown to a PDF, and deliver it to the client. Sometimes, we additionally document in a Jupyter Notebook.
Step 3 – Collect the Data
As a consulting firm, we need to collect data from the client. It comes in one of two ways: the client dumps data to us, or we work with the client to determine what data we want, and we give them a format that they can give it back to us in. We prefer all the data in a tabular format, CSV or Excel, that is viewable and readable.
The client data dump, for us the most common collection method, entails data straight from their production systems. We take that data and figure out how it maps to our data format. It’s not usually model-friendly, and we call it the “raw data.” With Python and pandas, we make the data model friendly in a “model data format.” This may entail transforming a calendar date into discrete periods, for example, or getting rid of unnecessary data. There may be multiple production tables that comprise the data tables.
Sometimes we work with the client and create a data format together. In this case, the client executives reduce the data to pass us and thereby reduce our data processing work, though there is still some needed.
In working through the code, we often learn new things, and update our tidy data format accordingly. Another field may be needed, or there may be a misunderstanding to correct. We may need to add more data—we are always updating this document. When a new feature is added mid-project, you have to update your data format.
Once the input data has been done, add validation tests to help prevent the passing of bad data that will break the model. If there is an error, you’ll be able to give a user a better idea of what caused it. For example, ensure that no task takes longer than a resource can work. For another example, ensure that every task can be done by at least one resource. Make sure that a task that must be scheduled can be scheduled.
Consider a more aggregate example. The total resource hours must exceed all the time the tasks take to schedule. To do all the tasks, you better have enough processing time. Ensure there are enough tasks that can be assigned to resources in each resource group so you can meet the minimum number of tasks for that group. If a resource group has a minimum number of three tasks, but only one task can be assigned to a resource in that group, you will create an unfeasible model very quickly. Make sure that you have enough tasks so the model will not be unfeasible. Finally, confirm the total number of tasks performed by all the resource groups exceeds the number of input tasks.
In general, try to perform these activities in terms of the data definition, not in terms of the math. You don’t need an optimization specialist; any developer on your project can create these validations because they are data validations, not model validations.
Step 4 – Document Data Transformation
You must document data transformations to the tidy data, especially anything that may combine data into a new data input.
![]()
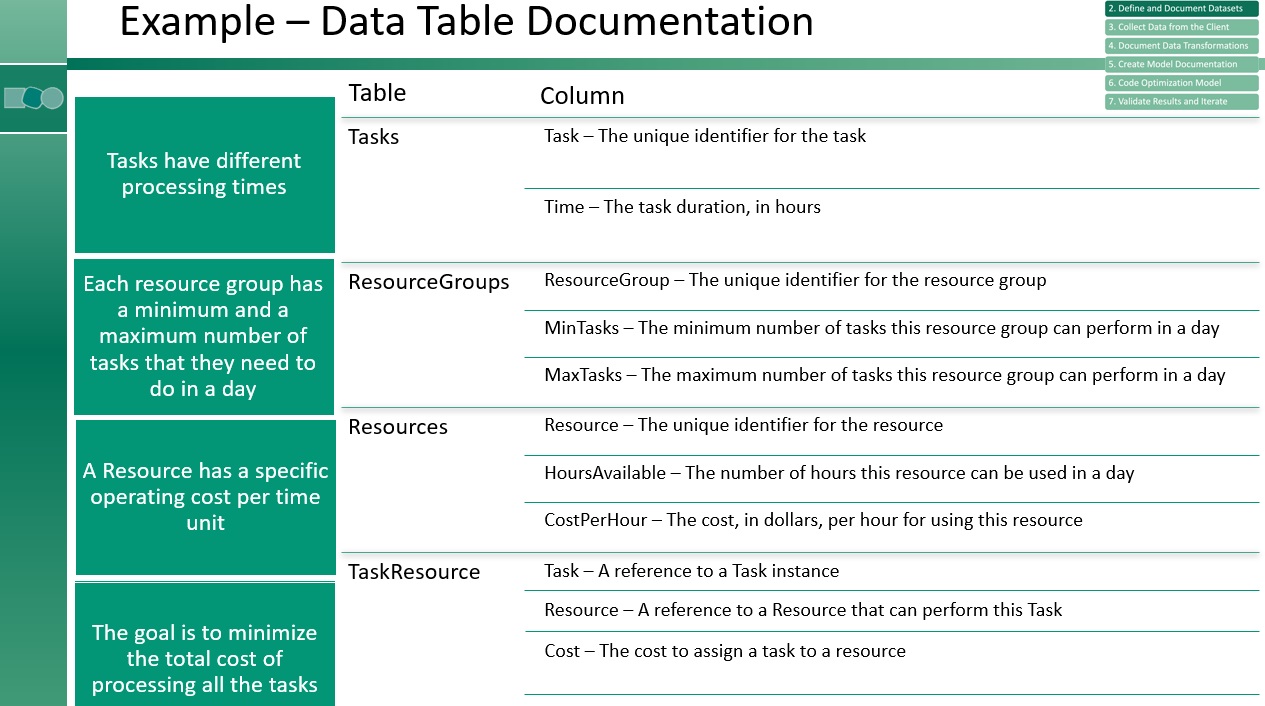
In our example, let’s say we had two inputs, α and β. They're both over the same set P. We need to calculate something called γ, which is the minimum of the sum of α and β for each p. We define γ to be the sum over p of the minimum of αp and βp. We need to document that in our data set as well. We have our field in the bottom of the data table that said “cost,” and must be calculated. We have θRT, the product of the time it takes to do unit T and the cost per time unit of using resource R. Tasks have time, resources have costs per hour, and each T has some set of resources that can do it. Task one could be done by A, B, C, D, E, two only by D, E, and F. And so on. We know what tasks and what resources, so we need to multiply those together, and that gives us our cost, our θ matrix. Notice that we didn’t define the TaskResource column as a bunch of zeroes; we always define it sparsely using the tidy data format.
Step 5 – Create Model Documentation
When you know what goes into your model, you need to figure out what the model actually does. That includes building decision variables, what decisions to make. In general, we use a single lowercase English letter for our decision variable. Then we have sets of those variables and we use subscripts or superscripts on those. Then we add constraints.
What rules must the model follow? Sometimes we merge the documenting and writing together a little. When writing, add only one constraint at a time so you can validate that the model is still feasible and it works every time you add a new constraint type. Then add the objective function or functions. In some cases, we allow a user to choose which objective to schedule or use.
In both math and “plain English,” write each constraint, decision variable, and objective so it’s understandable and deliverable to a larger audience. Establishing a common understanding facilitates reviews and interaction with other modelers and team members. We often present and confirm rules with business executives without the math: “This is the list of constraints we heard you say you needed in the model. These are the rules you told me that we needed to implement.”
Lastly, create a solution validator to see if you are calculating the constraints and the objective correctly.
Step 6 – Code the Optimization Model
For complicated models, we often start with the prototype in a Jupyter Notebook, one of my favorite tools it’s easy to go back and change and rerun as you go. The Jupyter Notebook enables a one-constraint-at-a-time feel.
In delivering optimization systems to clients, we often end up creating a RESTful service endpoint that interfaces with our model. Essentially it is a wrapper that lets the client parse the data so we can perform the data transformation, write the model, and send back a solution.
Through this separation, you can create only the model without the service, which allows for parallel development. Someone can write the frontend of the data parsing and the visualization pieces, while a modeler works on the actual code. These two team members divide the model, taking data from the flat file for example, and then plum in the actual service data.
Step 7 – Validate the Results and Iterate
When you review results, obviously, it’s preferrable to have a real visualization. In a recent scheduling optimization project I worked on, the UI wasn’t finished, so we built a visualization tool to see the schedule. It's hard to validate a schedule without the Gantt view. Typically, client executives don’t want to constantly review a big data table. For visualizations, my favorite tool is Plotly. Some colleagues like Holoviews. There are many Python visualization packages.
A word of warning: clients often hate the first solution you show them. Either they hadn’t told you something important like a critical business rule or they hadn’t fully expressed what they wanted in the model. Show results early and start iterating on that process and work out the kinks.
The solution validator you created will let you validate the calculation of the objective and that you have met all the constraints. This code should be written by someone who has not written the model code. Using the same data inputs and the business rules document, this team member can independently write the business rules from scratch and validate that your math is correct. Ditto for the objective. This gives you both validation that your constraints are implemented correctly, and that you’ve calculated the objective correctly. You know now that your model meets their business requirements.
Three years ago, my colleague Irv Lustig posted on this very topic. We have advanced our methodology since then, based on our project experiences. I hope you enjoyed this update. For further reference, visit this Github page. Feel free to email me if you'd like to talk.